How do I download graphs & charts from the Research section?
You may want to use some of the graphs and charts that are generated under the Research Tab for your newsletter, board report, or presentation. In this article, we will walk you through how to download the graphs and charts as image files.

The graphs and charts automatically populate with information based on the section you have highlighted on the map.
1. To get started, in the map in the Research tab, click on an area that you are interested in generating reports on.
2. On the left panel, select the Zoom Level that you want to apply to the area you have selected.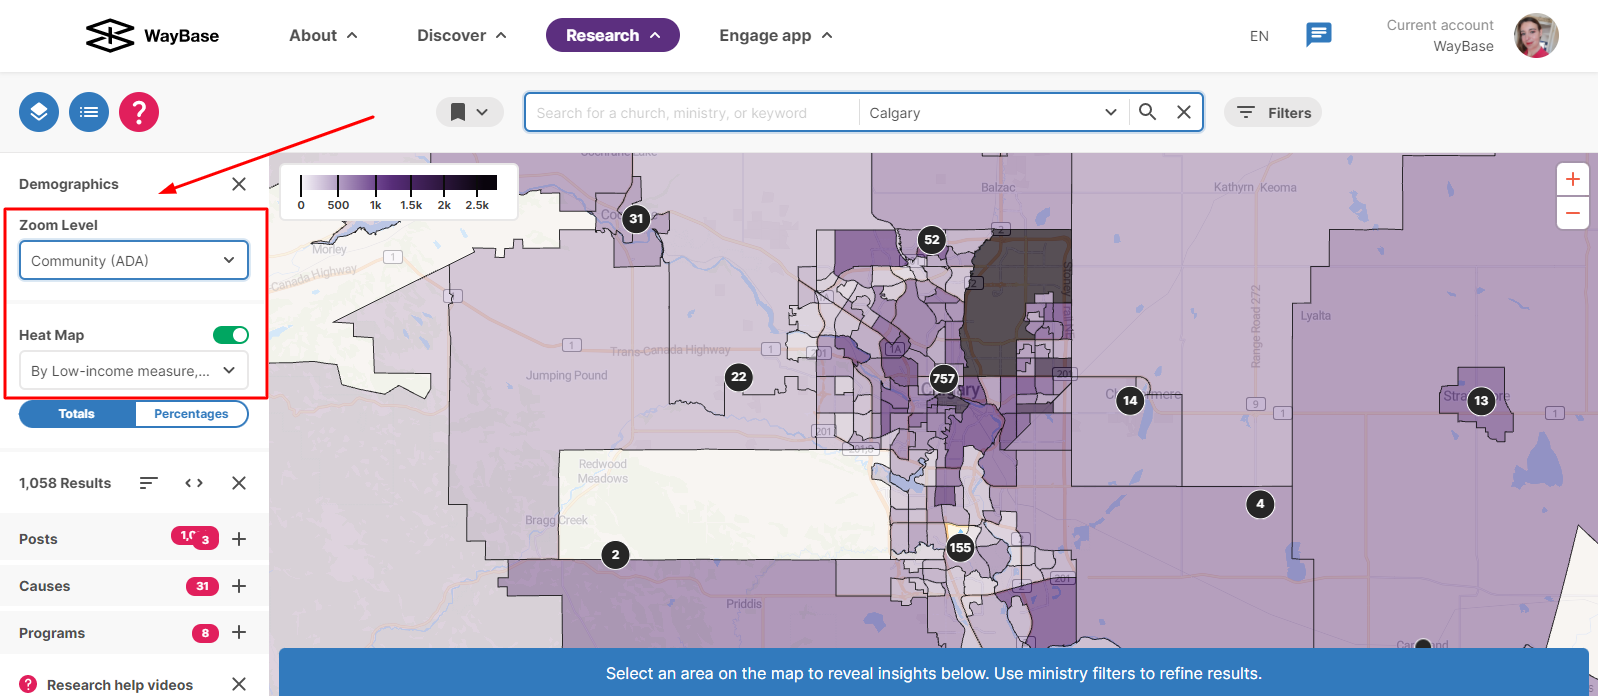
3. Then, click on the Show button on the lower right corner of the map. This will scroll up the statistics and data of the area you selected across different categories. 
4. Scroll down and select the category you are interested in downloading data reports on.
5. Once you have found the graph/chart that you would like to download, click on the  button visible on the chart.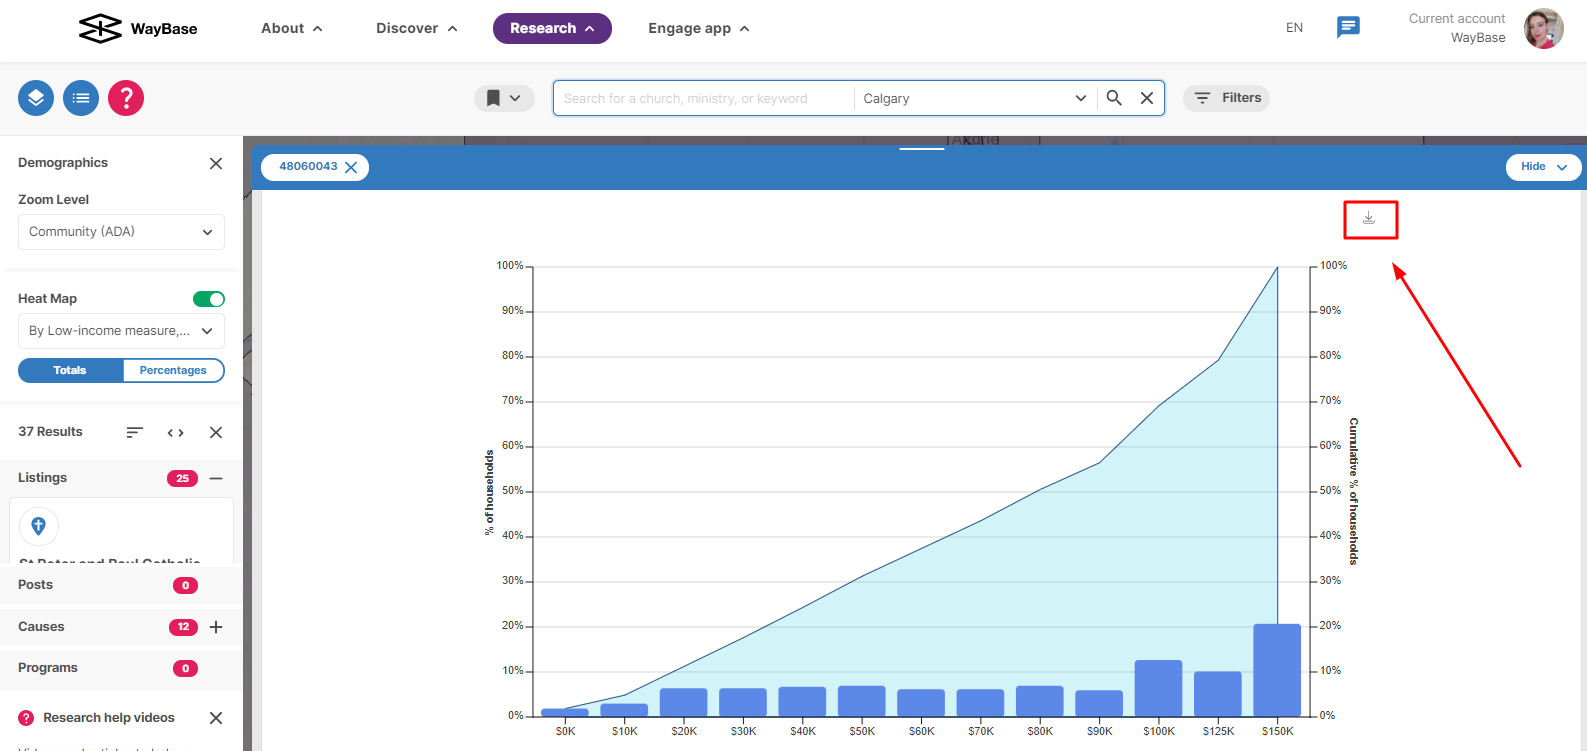
6. Proceed to click Download in the pop-up box that appears. The graph will download to your browser's default downloads location.